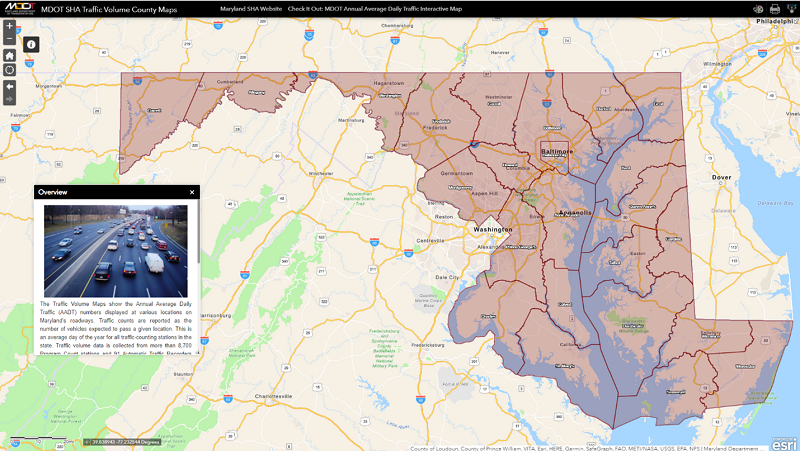
Traffic Volume Maps by County
The Traffic Volume Maps show the Annual Average Daily Traffic (AADT) numbers displayed at various locations on Maryland's roadways. Traffic counts are reported as the number of vehicles expected to pass a given location. This is an average day of the year for all traffic-counting stations in the state. Traffic volume data is collected from more than 8,700 Program Count Stations and 91 Automatic Traffic Recorders (ATRs) located throughout Maryland.
Program Count data is collected (both directions) at regular locations on either a three-year or six-year cycle, depending on type of roadway. Growth factors are applied to counts that were not taken during the current year and the counts are factored based on the past yearly growth of an associated ATR. Counters are placed for 48 hours on a Monday or Tuesday and are picked up that Thursday or Friday, respectively. The ATR and toll count data is collected on a continuous basis. The toll station data is provided by Maryland Transportation Authority.
To find a Traffic Volume Map please click on the county in the map below.
View map in full screen or on mobile device
The entire 2024
Maryland Traffic Volume Map (37.5 MB) is available as a PDF file.
The Traffic Volume Maps from previous years (2023) are available by county as PDF files:
Archive.